Loading…
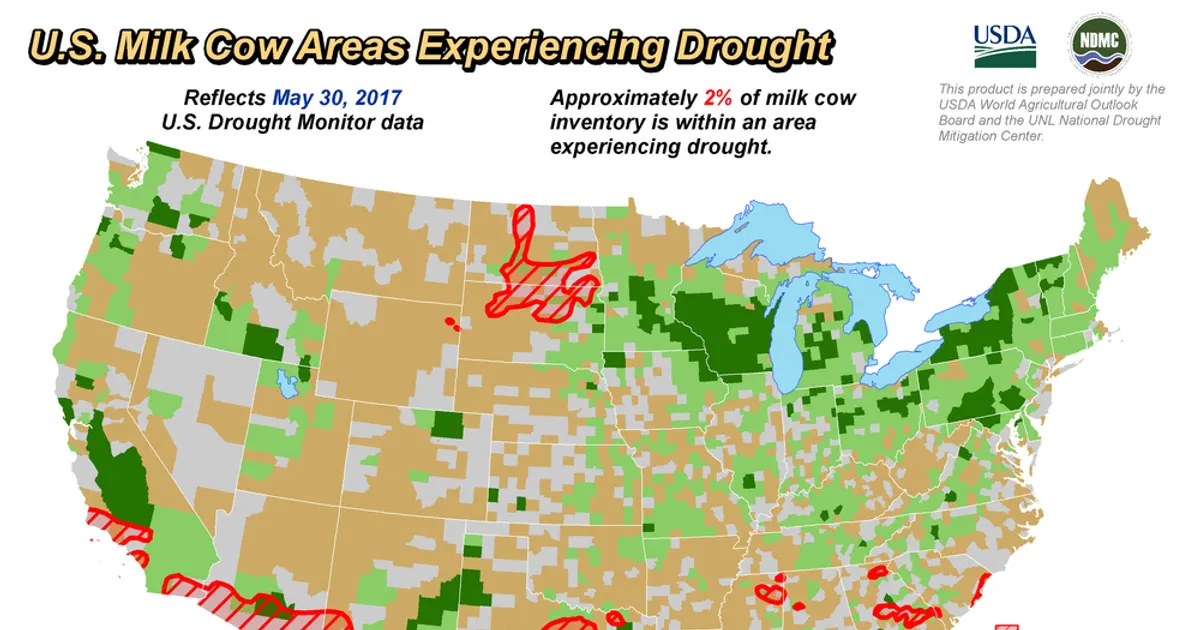
The National Drought Mitigation Center and USDA released maps showing where drought is affecting cattle, hogs, sheep, hay and alfalfa production across the continental US. The maps are updated weekly from the Drought Monitor, and field crop maps for corn, cotton, soybeans and wheat are planned.
The tool improves visibility into drought-driven livestock and forage stress, which can influence feed demand and cattle and hay prices, but it does not itself signal a price move.
 drought.govJun 2, 2017
After 3,207 past report events, Corn moved a median +0.2% over 5 sessions (54% higher; middle half -1.3% to +1.7%), and +0.5% over 20.
After 2,389 past report events, Soybeans moved a median 0.0% over 5 sessions (50% higher; middle half -1.6% to +1.9%), and +0.1% over 20.
Moves of each commodity's benchmark from the last close before the event. Historical reads pool past events of the same kind; they describe what happened, not what will. Not investment advice.
