Loading…
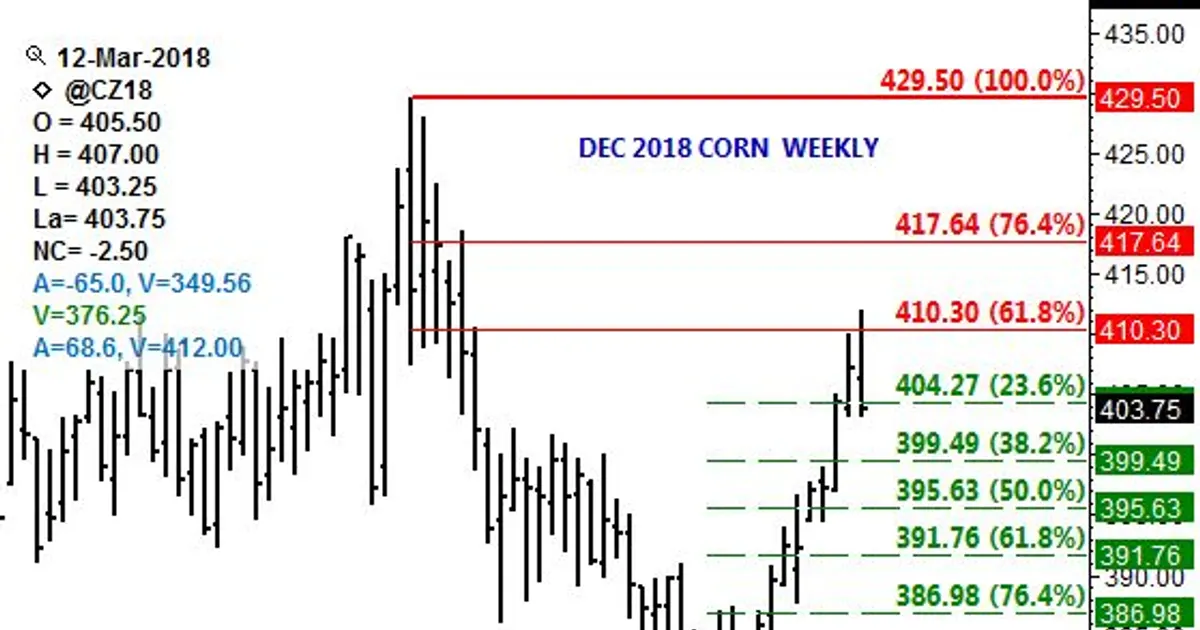
DTN's national cash corn index closed at $3.45, down 8.5 cents for the week. July 2018 futures closed 7 cents lower at $3.91, and December 2018 closed 3.5 cents lower at $4.03 3/4.
Technical analysis points to a shift into intermediate-term downtrends on the weekly charts.
The analysis describes chart signals and weekly declines in cash and futures corn without a new fundamental cause. Traders watching these support levels may see further selling pressure on corn prices.
 dtnpf.comDarin Newsom DTN Senior AnalystMar 18, 2018
Not enough comparable past events yet for a historical read.
Moves of each commodity's benchmark from the last close before the event. Historical reads pool past events of the same kind; they describe what happened, not what will. Not investment advice.
