กำลังโหลด…
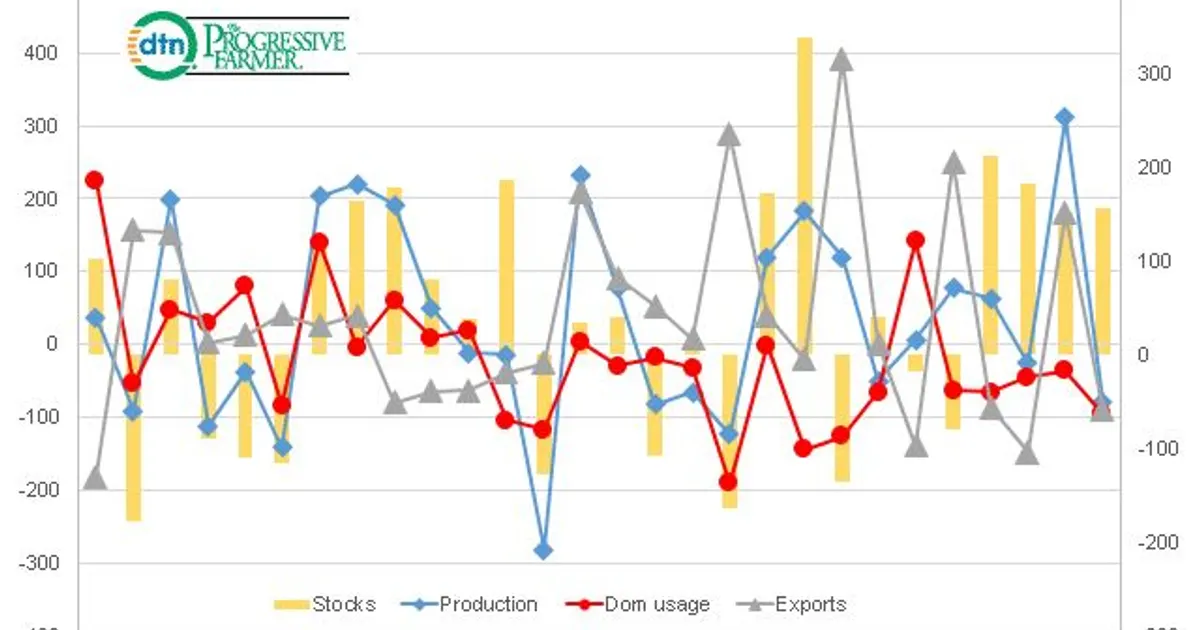
DTN analyst Joel Karlin reviewed historical revisions between May USDA wheat ending stock projections and final figures 18 months later. From 1990 to 2017, final U.S. wheat stocks averaged 42 million bushels above the initial May estimate, mainly because production came in higher.
The analysis is historical context on how far wheat stock estimates typically move, and it does not describe a new supply change, so price impact is limited.
 dtnpf.comJoel Karlin24 พ.ค. 2561
หลัง 406 เหตุการณ์รายงานที่เป็นกลางในอดีต ข้าวสาลี (SRW) เคลื่อนไหวเฉลี่ย -0.2% ใน 5 วันทำการ (47% สูงขึ้น; ช่วงกลาง -1.6% ถึง +1.5%) และ +0.0% ใน 20 วัน.
การเคลื่อนไหวของราคาอ้างอิงของแต่ละสินค้านับจากการปิดตลาดครั้งสุดท้ายก่อนเหตุการณ์ ข้อมูลย้อนหลังรวมเหตุการณ์ชนิดเดียวกันในอดีต ซึ่งบอกสิ่งที่เกิดขึ้น ไม่ได้บอกสิ่งที่จะเกิด ไม่ใช่คำแนะนำการลงทุน
