Lädt…
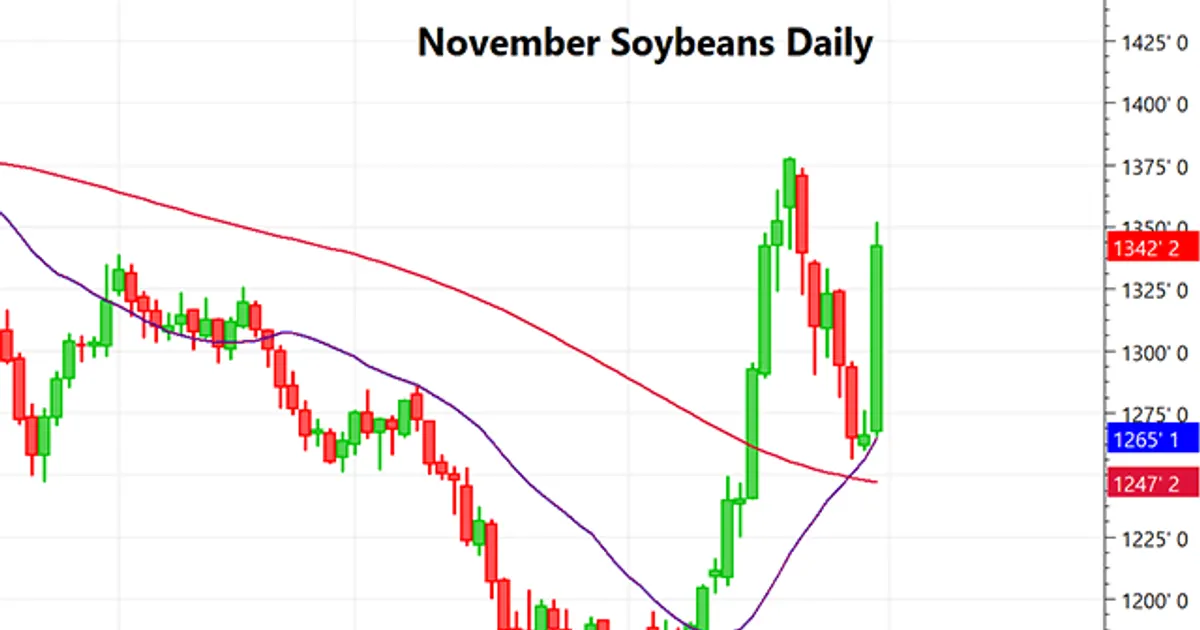
November soybean futures jumped after USDA's June stocks and acreage reports showed soybean plantings about 4 million acres below March intentions. Corn June 1 stocks came in at 4.106 billion bushels, the lowest since 2013-14, and corn plantings were 94.1 million acres, well above trade estimates.
The soybean acreage shortfall and tighter corn stocks support prices for both crops, with lower soybean supplies adding support to meal and oil.
 dtnpf.comDana Mantini30.06.2023
Nach 747 vergangenen Ereignisse (bullisch, Bericht) bewegte sich Sojabohnen im Median über 5 Handelstage um +0,3 % (54% höher; mittlere Hälfte -1,4 % bis +2,1 %) und über 20 Handelstage um +0,8 %.
Nach 414 vergangenen Ereignisse (bullisch, Bericht) bewegte sich Sojaschrot im Median über 5 Handelstage um -0,1 % (48% höher; mittlere Hälfte -2,1 % bis +2,3 %) und über 20 Handelstage um +0,3 %.
Nach 770 vergangenen Ereignisse (neutral, Bericht) bewegte sich Mais im Median über 5 Handelstage um +0,2 % (54% höher; mittlere Hälfte -1,1 % bis +1,6 %) und über 20 Handelstage um +0,7 %.
Veränderungen des Benchmarks jedes Rohstoffs seit dem letzten Schluss vor dem Ereignis. Historische Werte bündeln frühere Ereignisse derselben Art; sie beschreiben, was passiert ist, nicht was passieren wird. Keine Anlageberatung.
The June 30 Acreage report showed corn plantings of 94.1 million acres, well above trade estimates, which is bearish for supply and likely drove the sharp drop, partly offset by low June 1 stocks.
The USDA June Acreage report (soybean plantings ~4M acres below March intentions) is the likely cause of the soybean surge, but it was released 2023-06-30, after the move window ending 06/29, so this is only a possible link via pre-report positioning.
